
D2L Quiz Statistics
Once you receive completed quizzes from students, you can view Quiz Statistics such as grade distribution, grade average, question statistics, and user statistics on the Statistics page. This is useful for analyzing the effectiveness of a quiz and identifying areas for improvement/redesign.
Note: D2L does not collect statistics on questions randomly drawn from a pool.
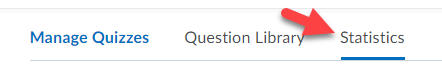
- Navigate to quizzes (Course>Assessments>Quizzes).
- The Manage Quizzes tab will open. Select the Statistics tab.
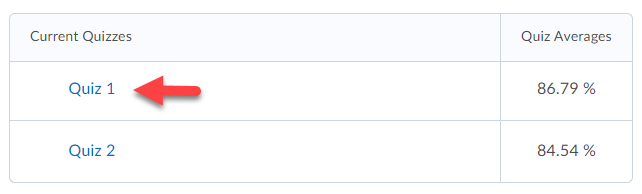
- Select the name of the quiz to view its statistics.
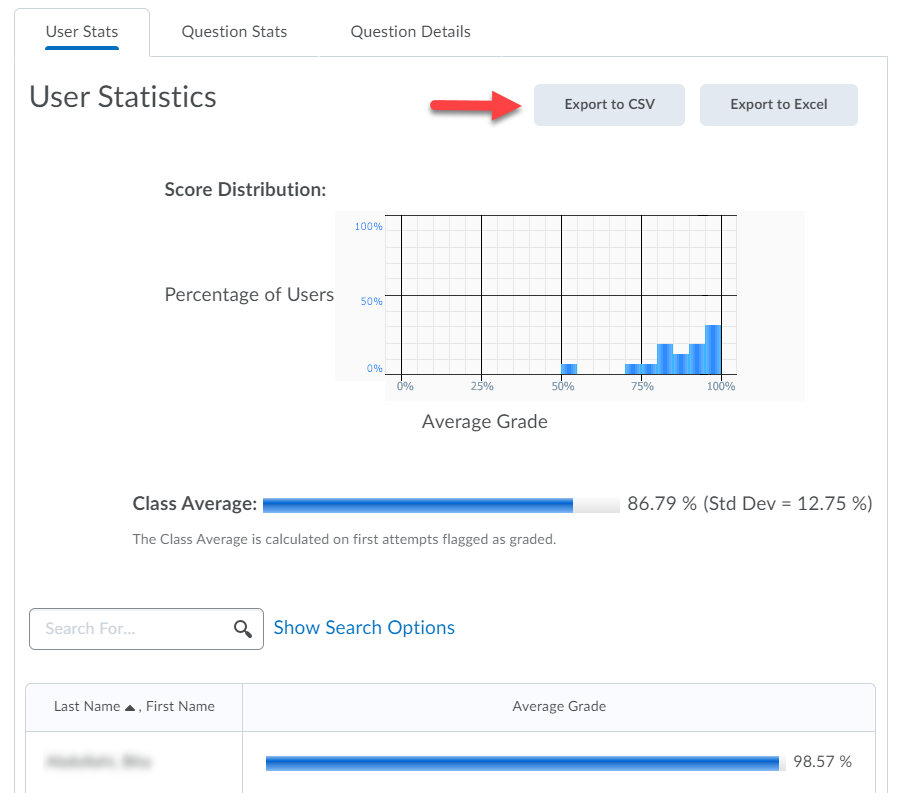
- There are three tabs available for viewing quiz data:
User Statistics
This allows you view the statistics of all users who took the quiz.
Question Statistics
This gives a view of the statistics of each question in the quiz.
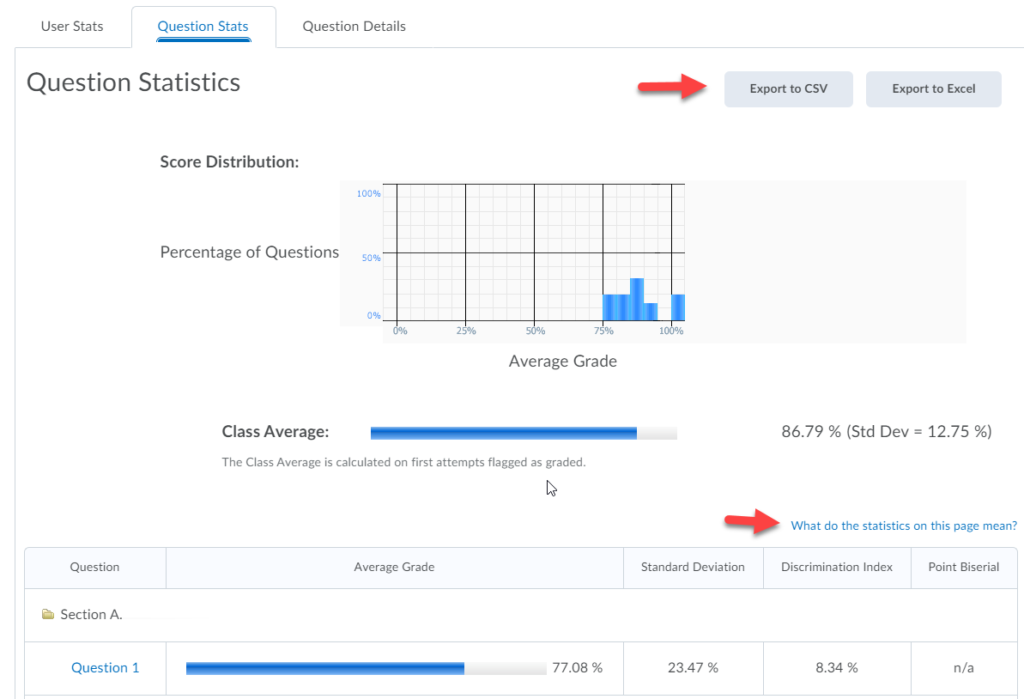
Question Details
This gives information on each question. To find out what the statistics on this page mean, click on What do the statistics on this page mean?
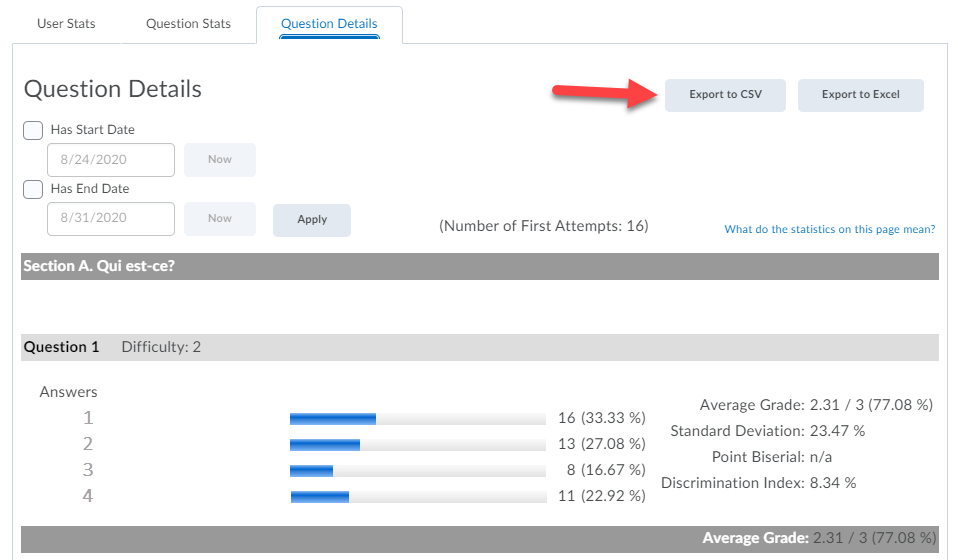
- Click Export to CSV or Excel for any of the three data options if you want to save the test’s statistics to your computer.
More on Quiz Statistics and Attempt Logs
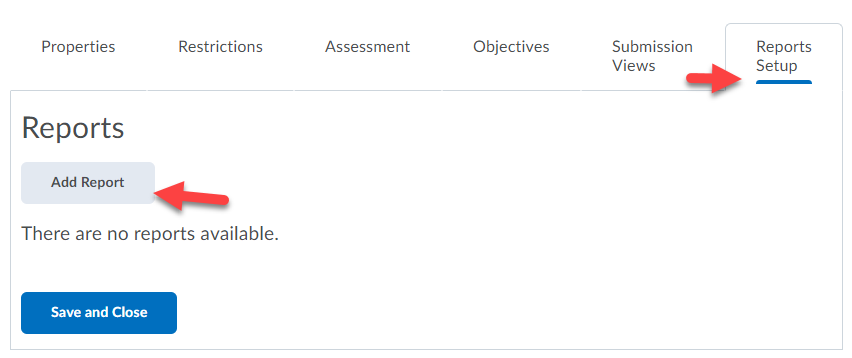
If you would like to export a customized quiz report you must set up quiz reports in the Reports Setup tab for the appropriate quiz before you can view or export reports.
- All statistics are calculated based on a user’s first attempt of the quiz. If a question is changed after attempts have occurred, then only the attempts on the newest version of the question are included in the statistical calculations.
- Select or deselect the Include exempted users in stats check box to either include or exclude exempted users in quiz statistics.
- Average grade is calculated only for first attempts of the quiz.
- For all reports, you can set a release date and select roles to release the report to.
